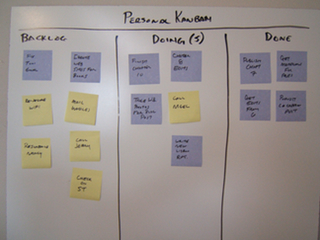
Personal Kanban
For the last few months we’ve been having a weekly book club at Omni. (Big thanks to Liz Marley for starting that!) This week we’re starting on Personal Kanban by Jim Benson and Tonianne DeMaria Barry. This slide set gives a nice high-level introduction to the idea.
For this book, each of us in the reading group is going to set up our own Kanban system, so we can live the ideas instead of just debating them. As a long time practitioner of David Allen’s GTD system using OmniFocus, I’m loath to abandon my fine-tuned system.
Perhaps I won’t need to.

Image from Personal Kanban 101
It seems like Personal Kanban and GTD have a lot in common. Both focus on getting ideas out of your head and into a trusted system. Benson and Barry call this your backlog. Allen calls it your project and someday-maybe list. Both focus on knowing what is on your plate so you develop an intuition about what to do and what to set aside. Allen focuses on acquiring that intuition through regular reviews of your lists. Benson and Barry advocate a more visual approach. They use post-it notes on a whiteboard for each task. They divide the board into areas representing your backlog, work in progress, and completed tasks. Besides showing the size of each pile, this is supposed to help you visualize your throughput as tasks move from backlog to in-progress to done.
Rather than abandon my OmniFocus system, I’m thinking of using OmniFocus’s Applescript interface to create a Kanban visualization. Working backwards,
- the Done area will show tasks that I checked off in the past couple of days;
- the Work-In-Progress area will show available tasks that are flagged or are due soon; and
- the Backlog area will show available tasks that aren’t in the Work-In-Progress area.
I’m already using flags in OmniFocus to highlight task that I’d like to complete today, so this isn’t much of a change in that respect. I’ll be curious to see whether the visualization affects my decision making on what projects to tackle and what to set aside. Kanban emphasizes placing limits on the amount of work-in-progress in order to maintain velocity. I really like Benson and Barry’s analogy to a freeway that allows more throughput at 65% capacity than at 100%, when it becomes a parking lot. I’ve always struggled with overcommitting, so I hope this is helpful.
Now to add a another project to my backlog to create the visualization. Hmm, might be a good excuse to dust off my Ruby programming skills…

